Competitive Intelligence Dashboard
Problem
Continuously monitoring competitors and keeping competitive intelligence up to date is time-intensive, fragmented, and difficult to scale. Teams often rely on manual research across multiple sources, making it hard to maintain a shared, real-time understanding of the competitive landscape.
Solution
CompIntel AI
Competitive Intel. On Autopilot.
CompIntel AI is a competitive intelligence dashboard built using Google AI Studio. Users enter a competitor’s website URL, and Gemini scans recent news, customer reviews, and product updates to generate a real-time intelligence profile. The tool reduces manual effort while helping teams quickly identify patterns, shifts, and strategic signals.
My Roles
Prompt Engineer, UX & Interaction Designer
I led the end-to-end UX approach, from problem framing and research to prompt design, data visualization decisions, and system logic.
I led the end-to-end UX approach, from problem framing and research to prompt design, data visualization decisions, and system logic.
Tools & Technologies
Google AI Studio — system design and Gemini integration
Claude & ChatGPT — prompt iteration and refinement
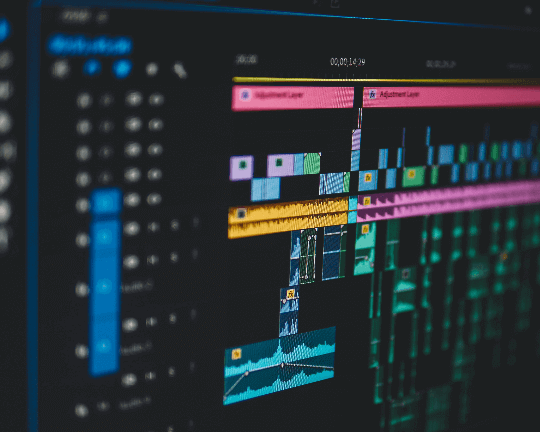
CapCut — editing screen recordings for use in process videosResearch & Business Context
-Organizations with mature competitive intelligence (CI) programs typically invest 0.4%–1.2% of annual revenue in CI activities. The CI tools market continues to grow, with AI increasingly used to track digital presence, sentiment, and competitor behavior.
-Typical CI projects cost $1,000–$2,000, while ongoing consulting services often exceed $1,500–$2,500 per month.
-ROI Perspective: Effective CI is widely regarded as a high-ROI function, often delivering value well beyond the $40,000–$150,000 invested in comprehensive intelligence programs.
Key Design Decisions
Framed the problem around time and cognitive load
Rather than focusing solely on data completeness, I designed the experience to minimize manual research effort and reduce the mental overhead required to synthesize competitive insights.
Rather than focusing solely on data completeness, I designed the experience to minimize manual research effort and reduce the mental overhead required to synthesize competitive insights.
Designed the URL-based input model
Allowing users to start with a single competitor URL lowers friction and mirrors how teams naturally begin competitive research.
Allowing users to start with a single competitor URL lowers friction and mirrors how teams naturally begin competitive research.
Structured outputs for scannability
Insights were organized into clear sections (news, reviews, updates, trends) to support quick comparison and decision-making.
Insights were organized into clear sections (news, reviews, updates, trends) to support quick comparison and decision-making.
Integrated UX as a competitive signal
I intentionally included user experience as a dimension in competitive positioning, alongside price, features, support, and innovation, reinforcing UX as a strategic differentiator rather than a secondary metric.
I intentionally included user experience as a dimension in competitive positioning, alongside price, features, support, and innovation, reinforcing UX as a strategic differentiator rather than a secondary metric.
Iterated on prompts as a design artifact
Prompts were treated as part of the UX. I used Claude and ChatGPT to refine clarity, consistency, and output usefulness, testing multiple variations to improve signal quality.
Prompts were treated as part of the UX. I used Claude and ChatGPT to refine clarity, consistency, and output usefulness, testing multiple variations to improve signal quality.
Building the Dashboard
Google AI Studio (Model: Gemini 3 Flash Preview)
Prompt:
Build a competitive intelligence dashboard. Users enter competitor URLs and the app should:
1. Use Google Search to find recent news and updates about each competitor
2. Extract key information: Product launches or feature updates, Pricing changes, Customer reviews and sentiment, News articles and press releases
3. Display a comparison table with: Competitor name, Last major update (with date), Overall sentiment score (1-10), Top 3 strengths (from reviews), Top 3 weaknesses (from reviews), Recent news headlines
4. Add a “Refresh” button to get latest data
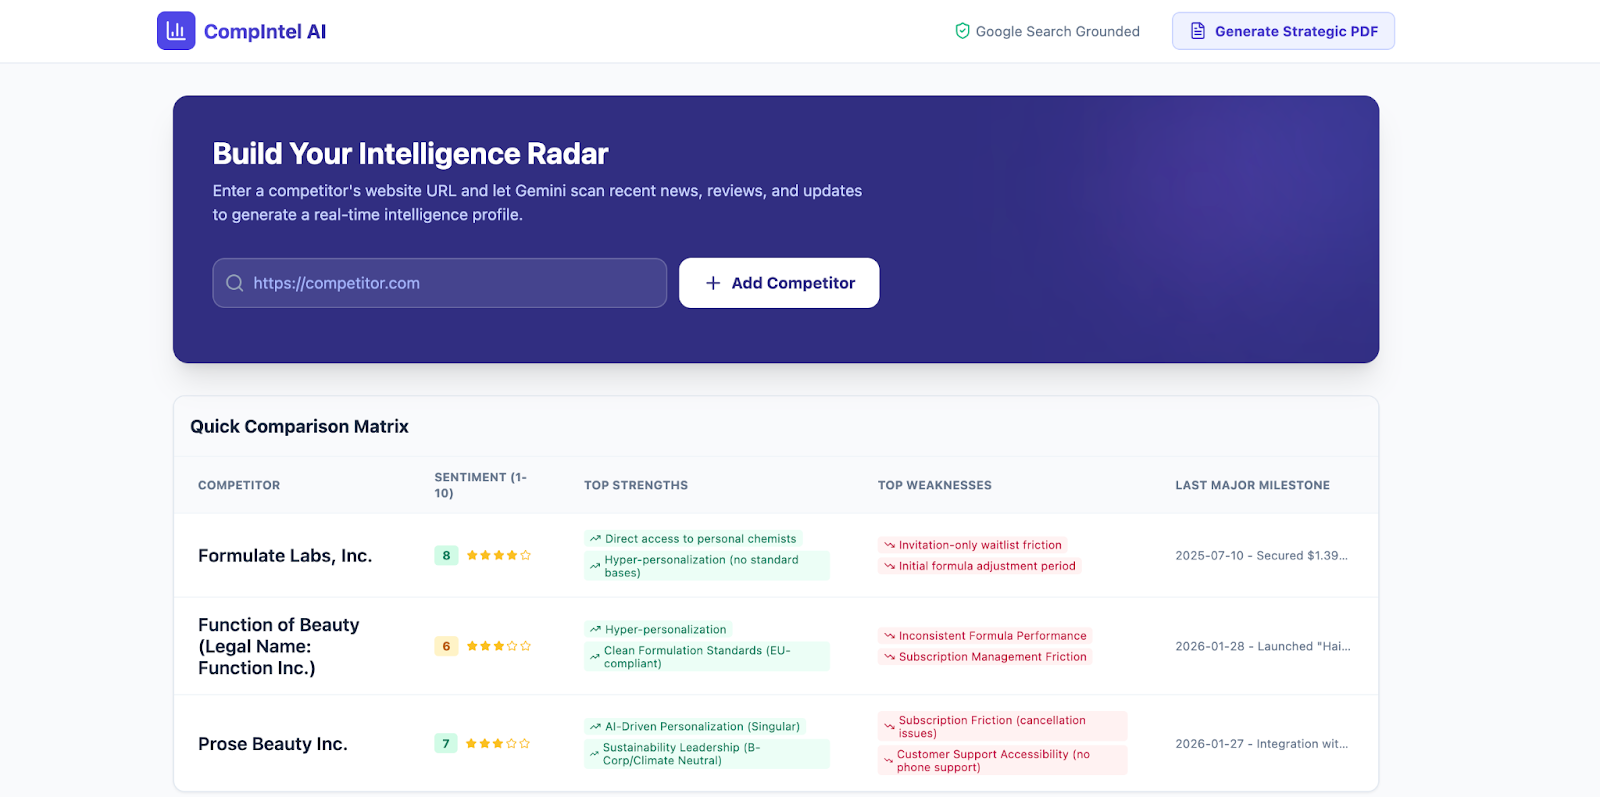
Use Google Search grounding for all data collection. Display results in a clean, professional dashboard layout.
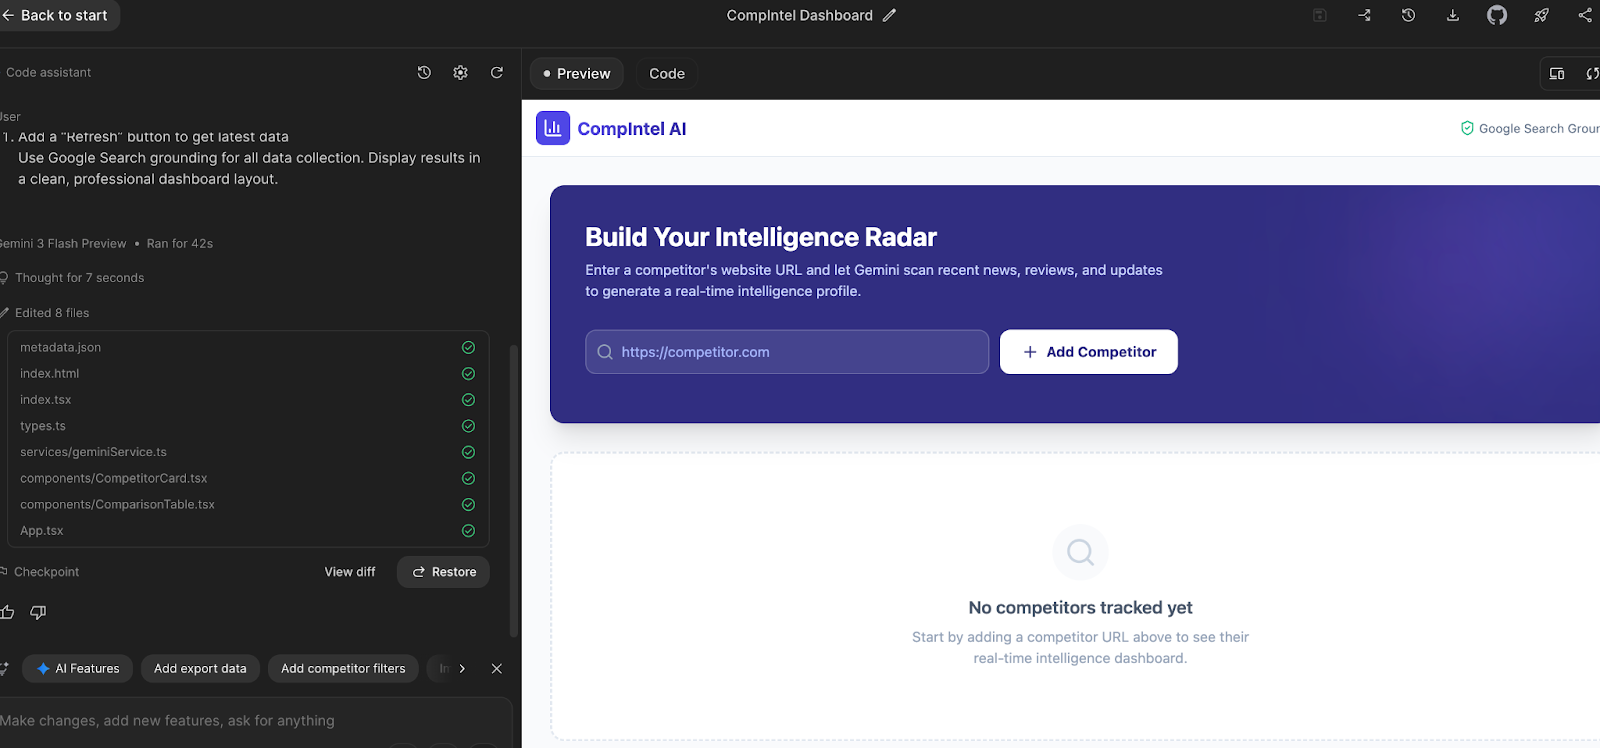
The beginnings of CompIntel AI.
Adding Visual Intelligence
Prompt:
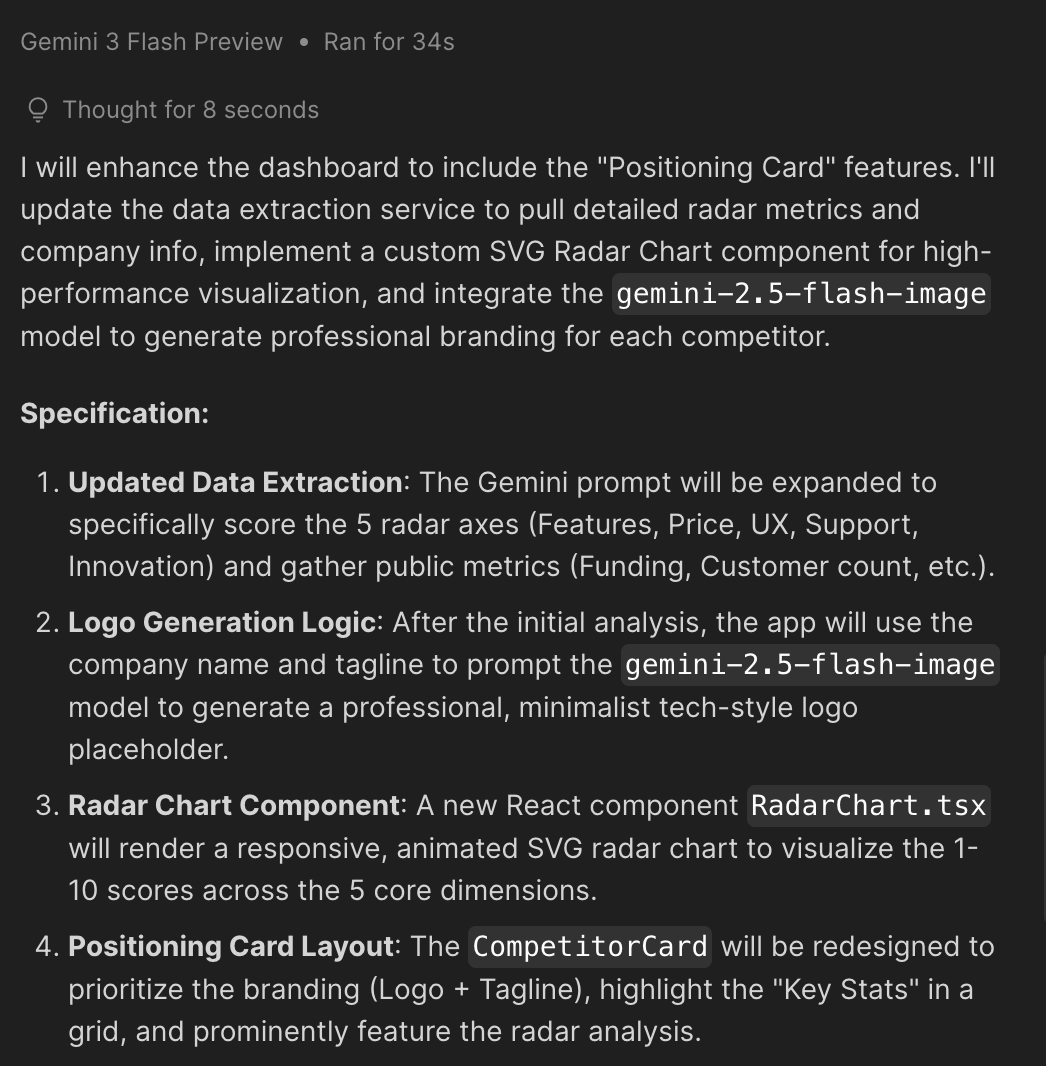
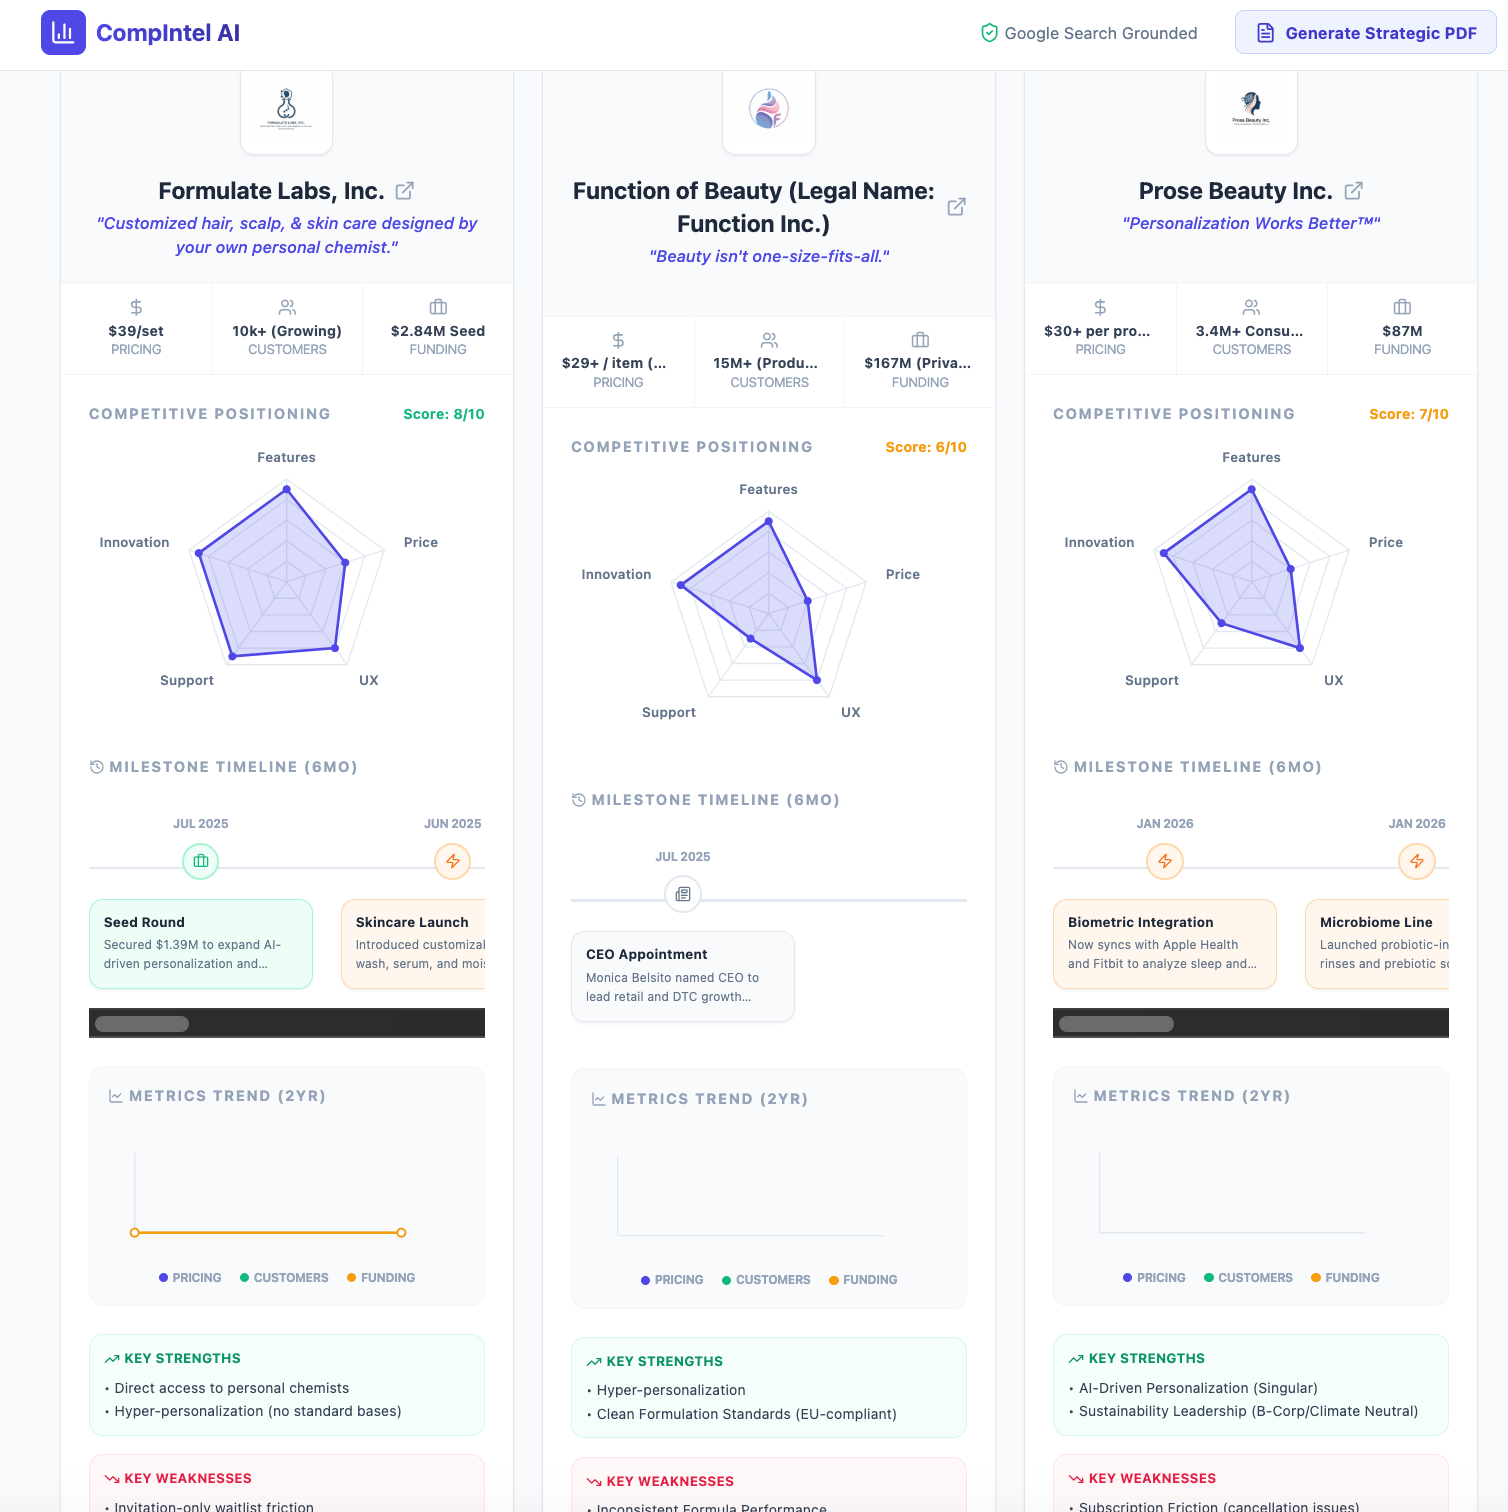
For each competitor, generate a visual “positioning card” showing:
- Logo (extracted from their website)
- Tagline
- Key metrics (if public): pricing, customer count, funding
- A radar chart comparing: Features, Price, UX, Support, Innovation (scored 1-10 based on reviews)
Use Nano Banana to generate placeholder logos if the actual logo isn’t available.
Enhancing the Data Visualizations
Prompt:
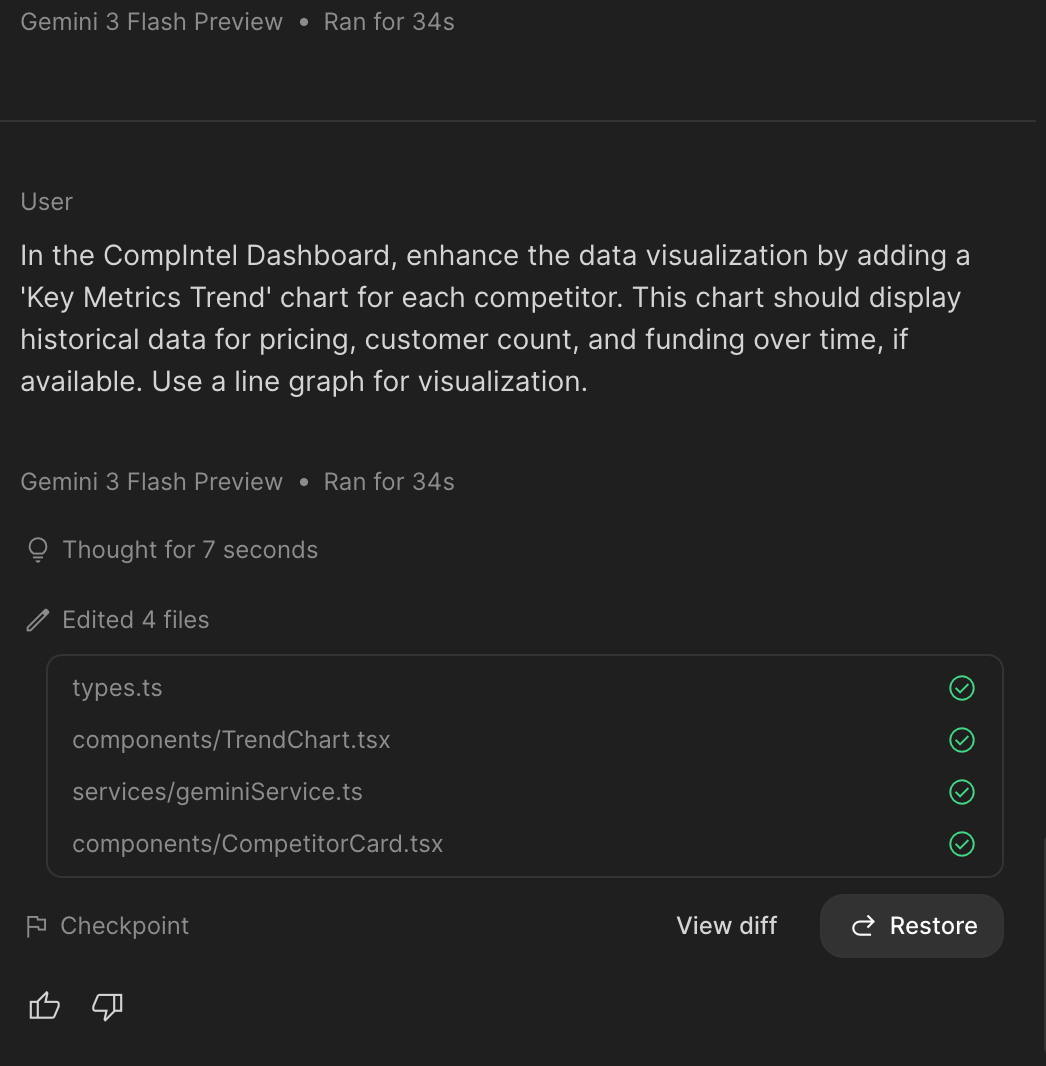
In the CompIntel Dashboard, enhance the data visualization by adding a 'Key Metrics Trend' chart for each competitor. This chart should display historical data for pricing, customer count, and funding over time, if available. Use a line graph for visualization.
Adding Trend Analysis
Prompt:
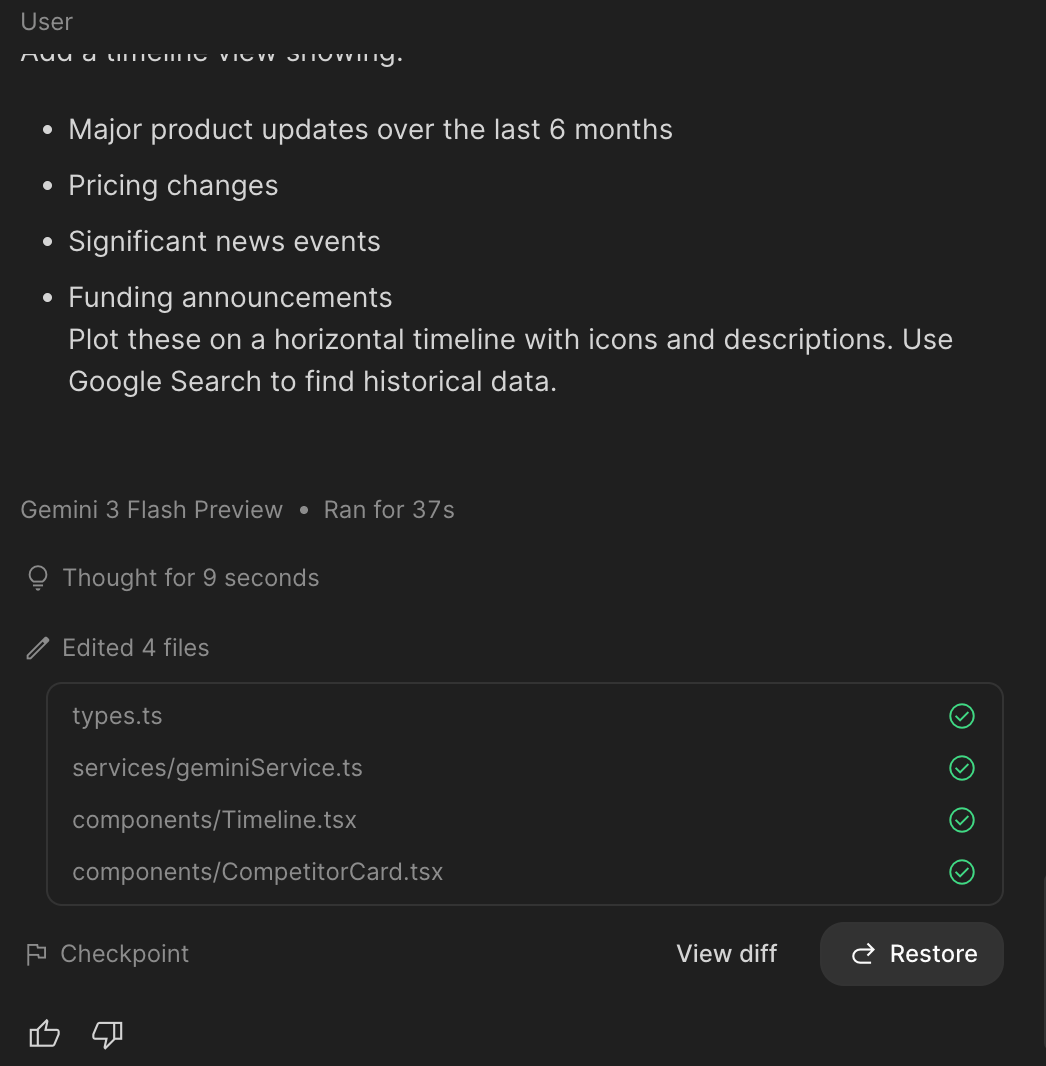
Add a timeline view showing:
- Major product updates over the last 6 months
- Pricing changes
- Significant news events
- Funding announcements
Plot these on a horizontal timeline with icons and descriptions. Use Google Search to find historical data.
Adding Automated Reports
Prompt:
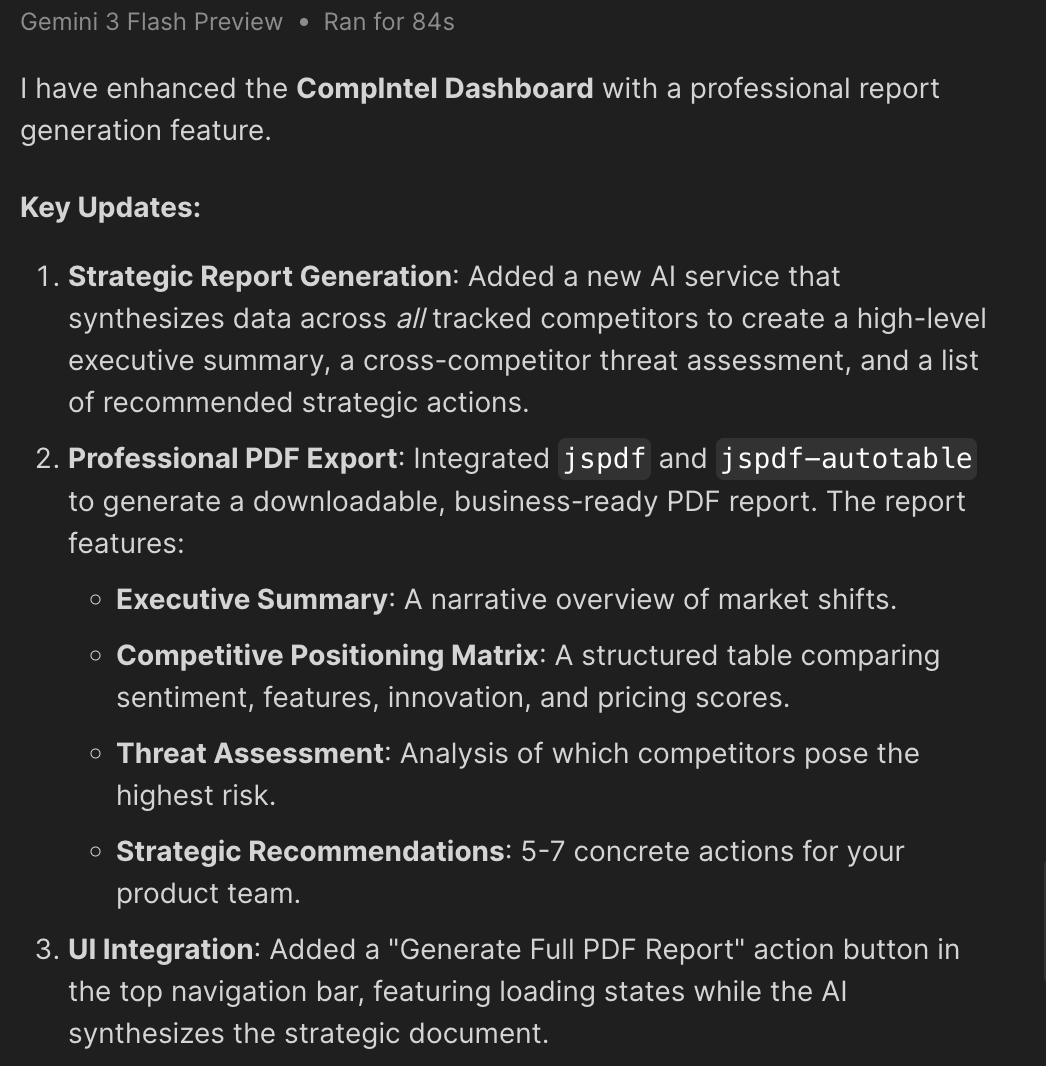
Add a “Generate Report” button that creates a downloadable PDF containing:
- Executive summary (AI-generated based on findings)
- Competitive positioning matrix
- Feature comparison table
- Threat assessment (which competitors are most dangerous and why)
- Recommended actions for our product team
Format as a professional business report with charts and tables.
Testing URL Inputs Custom Haircare Startups
I selected custom haircare startups as the testing context because they operate within a niche yet rapidly emerging market. Although there are currently few competitors, the barrier to entry remains high, requiring brands to differentiate themselves through strong product positioning and user experience. For startups at the ideation stage, research plays a critical role in assessing whether the potential return on investment outweighs the risk. This made custom haircare startups a relevant and realistic use case for evaluating the value of CompIntel AI.
URL inputs
Prose (https://prose.com)
Function of Beauty (https://functionofbeauty.com)
Formulate (https://www.formulate.co)
Testing
Testing Data Visualization Output
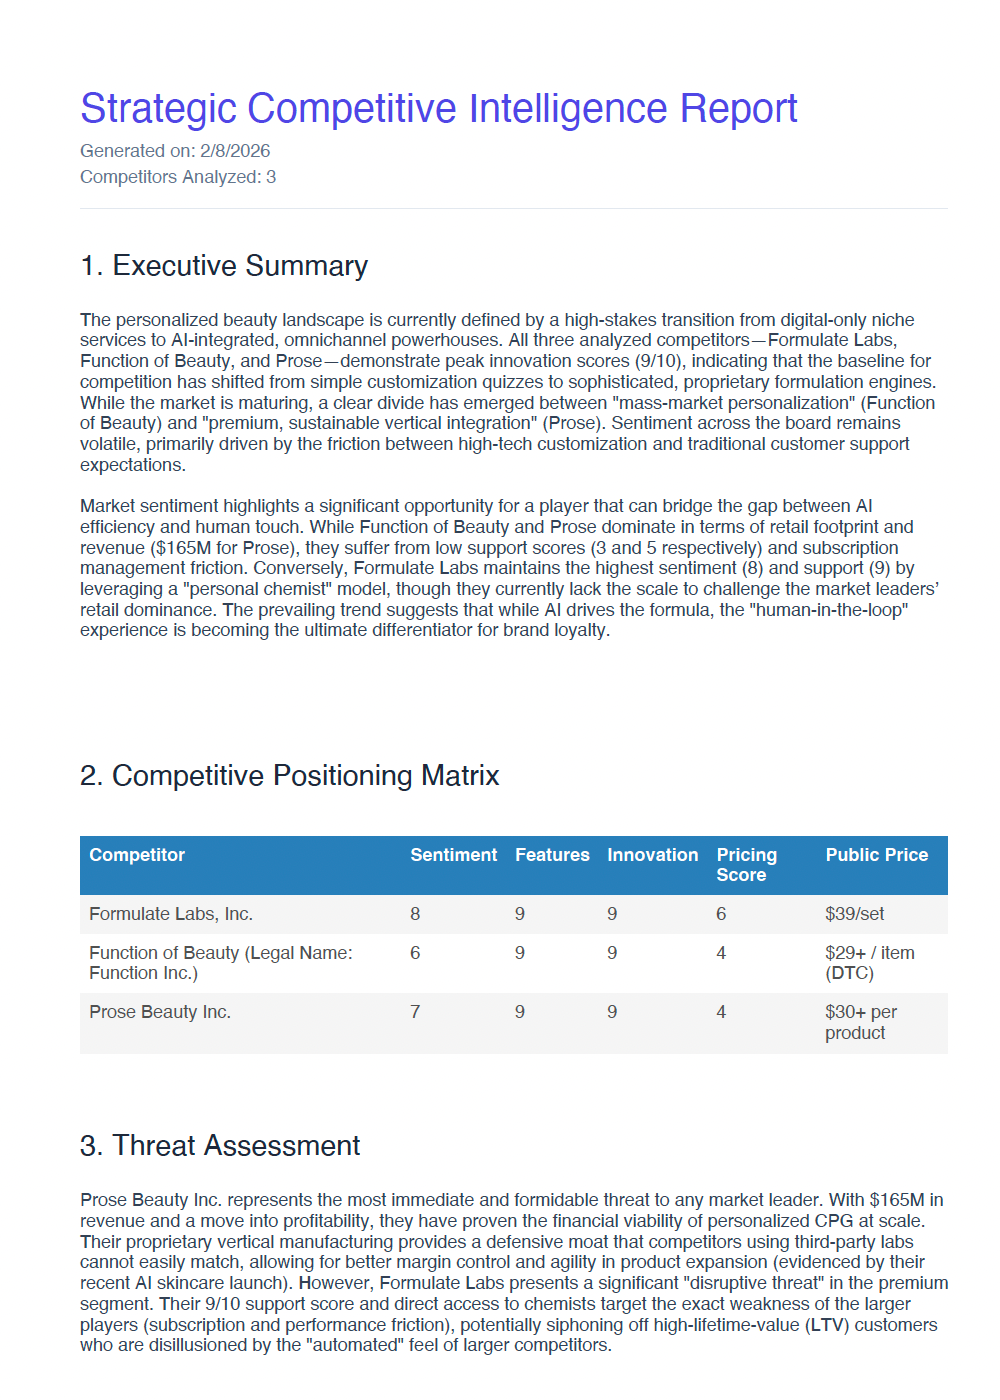
PDF Output
Refining the Report - Adding Customization
Prompt:
In the CompIntel Dashboard, enhance the 'Generate Report' functionality. Allow users to select specific competitors to include in the PDF report, and offer options to customize the report's content (e.g., exclude certain sections like threat assessment).
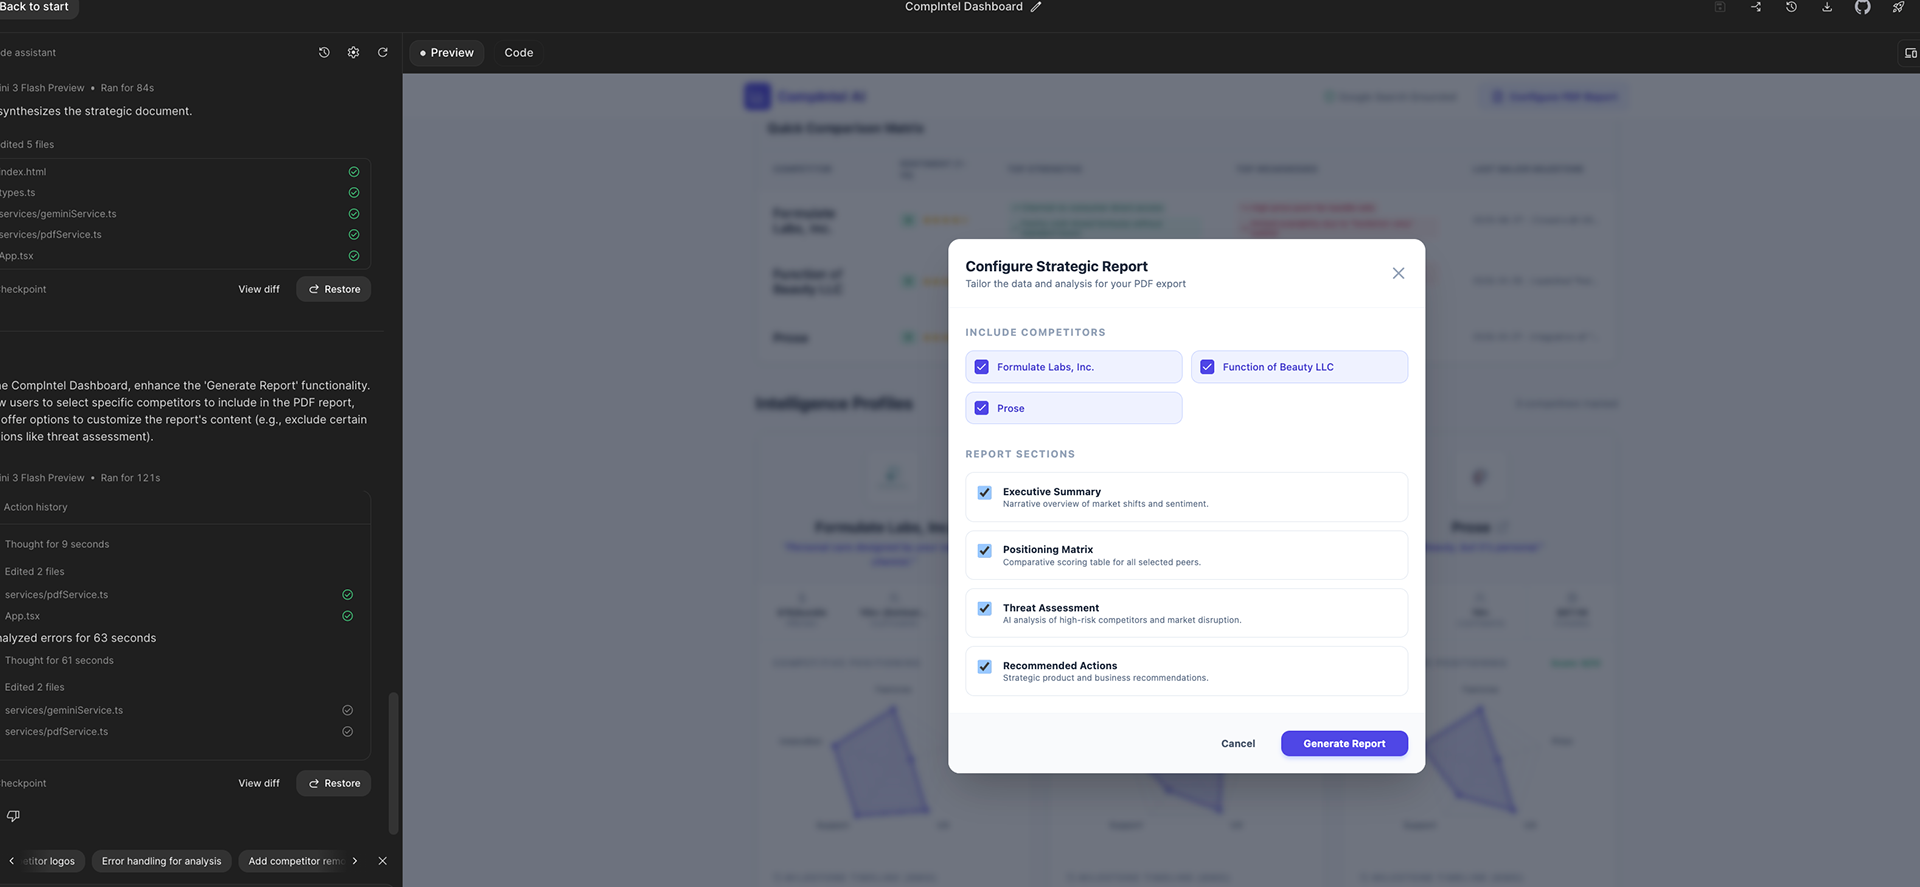
Adding options to customize the PDF report generated in CompINtelAI.
Tagline Generation using ChatGPT
Prompt:
Please suggest 3 edgy startup style slogans/taglines for the following product: CompIntel AI, a competitive intelligence dashboard built with Google AI studio. Enter a competitor's website URL and let Gemini scan recent news, reviews, and updates to generate a real-time intelligence profile.
Goal: full YC / SF startup edge 😈
Short. Sharp. Confident. Zero fluff.
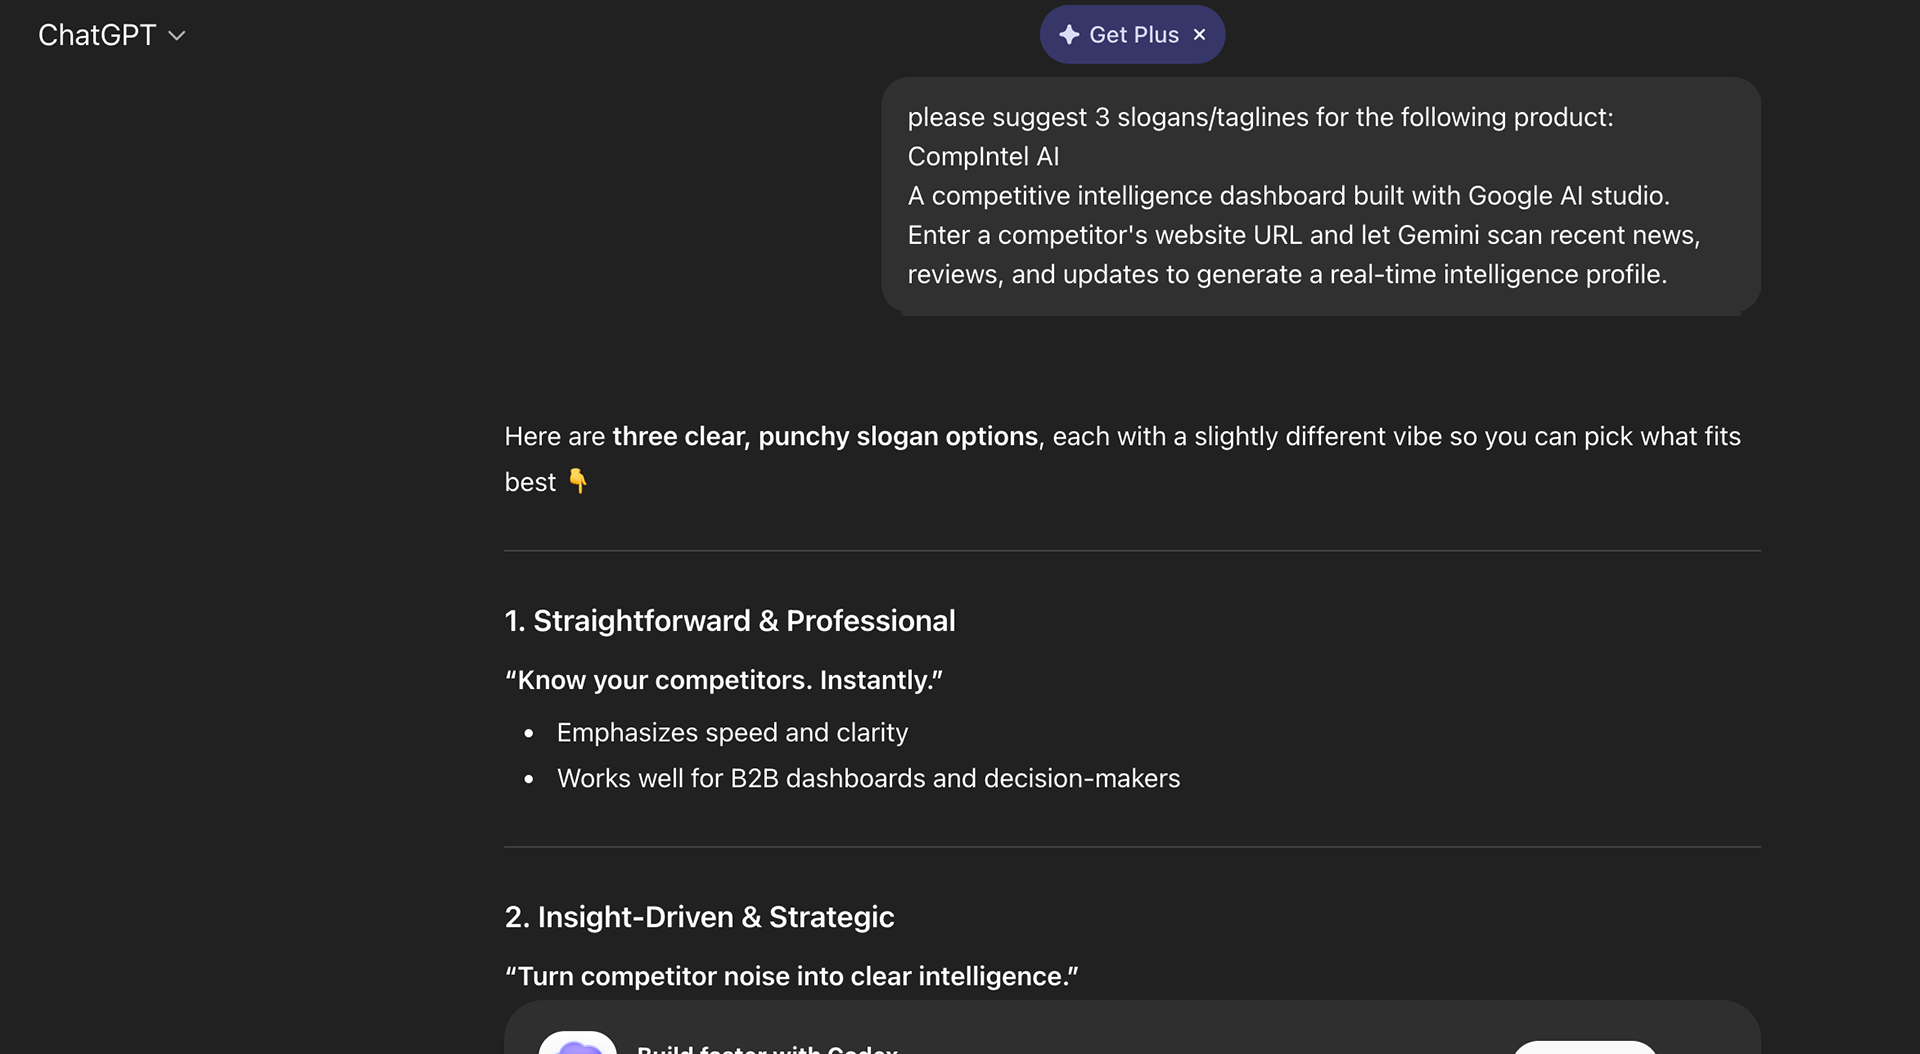
Generating Tagline Ideas in ChatGPT
Reflection
In future iterations, I would refine the data visualization prompts—particularly those related to competitive positioning, milestone timelines, and metrics trend data—to better support meaningful analysis. Viewing the visualizations through a user experience lens, I found the inclusion of UX within the competitive positioning graph especially engaging. Seeing user experience represented alongside factors such as price, support, features, and innovation helped illustrate how UX contributes to broader product strategy, rather than existing as a separate consideration.